Semigloss and Log-Log Plots 1t is a convenient and widely followed practice to plot •.he logarithm of frequency-response data rather than actual data values. If the logarithm of frequency is plotted along the horizontal axis, a wide frequency range can be displayed on a convenient size of paper without losing resolution at the low-frequency end. For example, if it were necessary to scale frequencies directly on average-sized graph paper over the range from I Hz to kHz, each small division might represent 100 Hz. It
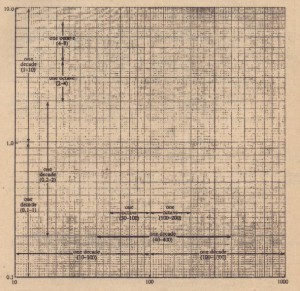
would then be impossible to plot points in the range from I Hz to 10 Hz, where the lower cutoff frequency might well occur. When the horizontal scale represents logarithms of frequency values. the low-frequency end is expanded and the high frequency end is compressed. One way in which a logarithmic frequency scale can be obtained is to compute the logarithm of each frequency and then label conventional graph paper with those logarithmic values. An easier way is to use specially designed log paper, on which coordinate lines are logarithmic ally spaced. It is tllvn necessary only to label each hen directly with an actual frequency value. If only one axis of the graph paper has a logarithmic ally spaced scale and the other has con conventional linear spacing, the paper is said to be semi/og graph paper. [f bOtil the horizontal and vertical axes are logarithmic, it is called log-log paper. Ally ten-to-one range of values is’ called a decade. For example, each of the frequency ranges 1 Hz to 10 Hz, 10 kHz to ]00 kHz, 500 Hz to 5 kHz, and Hz to 0.2 Hz is a decade. Figure 10-5 shows a sample of log-log graph paper on which ‘won full decades can he plotted along each axis. This sample is caller’ 2-cycle’-h-2-cycle/e, or simply 2 X 2, log-log paper. Log-log graph paper is available with different numbers of decades along each axis, including 4 X 2, 5 X 3, 3 X ,
and so forth. Notice that each decade ~song each axis occupies the same amount of space. Several horizontal and vertical decades are identified on the figure. Notice also that the graph paper is printed with identical scale values along each decade. The user must relabel the divisors in accordance with the actual decade values that are appropriate for the data to be plotted. Suppose, for example, that the gain of an amplifier varies from 2 to 60 over the frequency range from 150 Hz (0 80 kHz. Then the frequency axis must cover the three decades 100 Hz to 1 kHz, 1 kHz to to kf-Iz. and 10 kHz to 100 kHz, and the gain axis must cover the two decades I to 10 and 10 to 100.3 x 2 graph paper would be required. In Figure 10–5, the axes arc arbitrarily labeled with decades 0.1-1 and 1-10 (vertical). and 10-‘100 and 100-1000 (horizontal). An octave is any two-to-one range of values, such as 5-10, 80-160, and 1000- 2000. Notice in Figure 10-5 that every octave occupies the same length. Notice also that the value zero does not appear on either axis of the figure. Zero can never appear on a logarithmic scale. no matter how many decades are represented. because log(O) = -00. Serology graph paper is used to plot gain in dB versus the logarithm of frequency. When the frequency axis is logarithmic and the vertical axis is linear with its divisions k befell in decibels. the Guelph paper i’;’ essentially the same as 1011,-log paper Thus. a plot of an amplifier’s frequency response will. have the same general shape when constructed on either type of graph paper. Sociology graph paper is also used to plot phase shift on a linear scale versus the logarithm of frequency. Graphs of frequency response plotted against the logarithm of frequency are called Bode (pronounced ho-lIc) plots.’ , Tile cutoff frequency is the frequency at which the /{ail.l on a frequency-response plot is 3 dB less the midland gain. At cutoff, the gain is said to be “3 dB UP Ratliff frequencies are often called 3-d8 frequencies. The value is
J dB Hecate, the output voltage is V212 times its value at Rimbaud, and Figure 10-6 shows the voltage gain of an amplifier plotted versus frequency on log-log paper. Find .
1. the midland gain, in dB;
2. the gain in dB at the cutoff frequencies;
3. the bandwidth; .
4. the gain in dB at a frequency 1 decade below the lower cutoff frequency:
5. the gain in dB at a frequency 1 octave above the upper cutoff frequency; and
6. the frequencies at which the gain is down 15 dB from its mid-band value.
Solution .
1. As shown in Figure 10-6. the magnitude of the mid band gain is 250. Therefore .
• Am = 20 log,usu = 47.96 dB.
2. Since the gain al each cutoff frequency is 3 dB. less than the gain at mid band,
11,.(<11 cutoff’) = 47.Wl – 3 =: 44.% dB. •
3. The magnitude of the gain at each cutoff frequency is (V2/2)250 = l76.7X, As shown in Figure 10-6, this value of gain is reached at t. 30 Hz and at Ii = 10 kllz. Therefore. BW == Ji – j; = (10 kHz) – (30 Hz) = 9970 Hz.
•


